Every modern photo editing software contains histograms. Most cameras, including some compacts, also have an option to display histograms on an LCD screen while you are taking a picture.
The histogram is quite a complicated topic to understand for beginners, but here I’m going to teach you how to understand histograms properly.
What is a histogram?
Camera LCD displays are usually very small and it’s quite difficult to see what your photo really looks like. This is why a histogram is critically important. It gives you a mathematical representation of your photo exposure. The histogram shows you a summary of the tonal range of a certain image.
Brightness on a grayscale makes a histogram. It graphs your image tones from black on the left to white on the right and all shades of gray in-between.
There are 256 recorded values of brightness in a usual jpg image. 0 is completely black, 255 is totally white. Thanks to a histogram, every pixel of a picture is assigned its value.
Histogram examples
Let’s take a look at a few examples of images and their histograms. As I mentioned, an LCD screen of your camera is not big enough to give you a perfect review of your photo, and you might get home and find out that your image is overexposed or underexposed. The moment would be lost, so here is where you need to use the histogram.
Here are examples to help you understand a histogram:
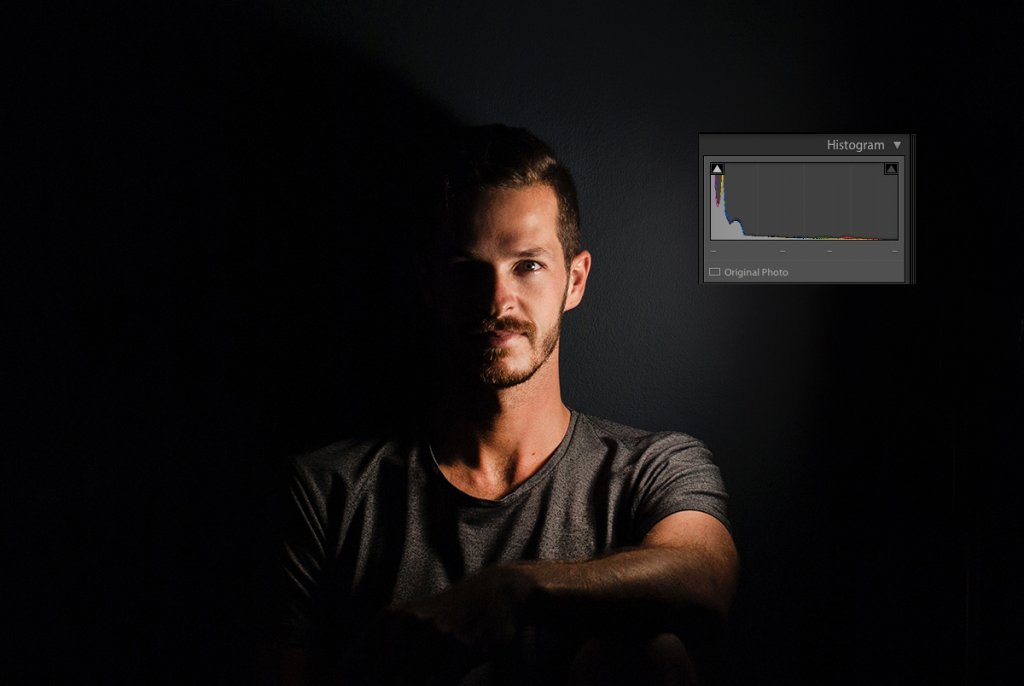
A histogram with a lot of dark pixels will be deflected to the left, just like on this portrait.
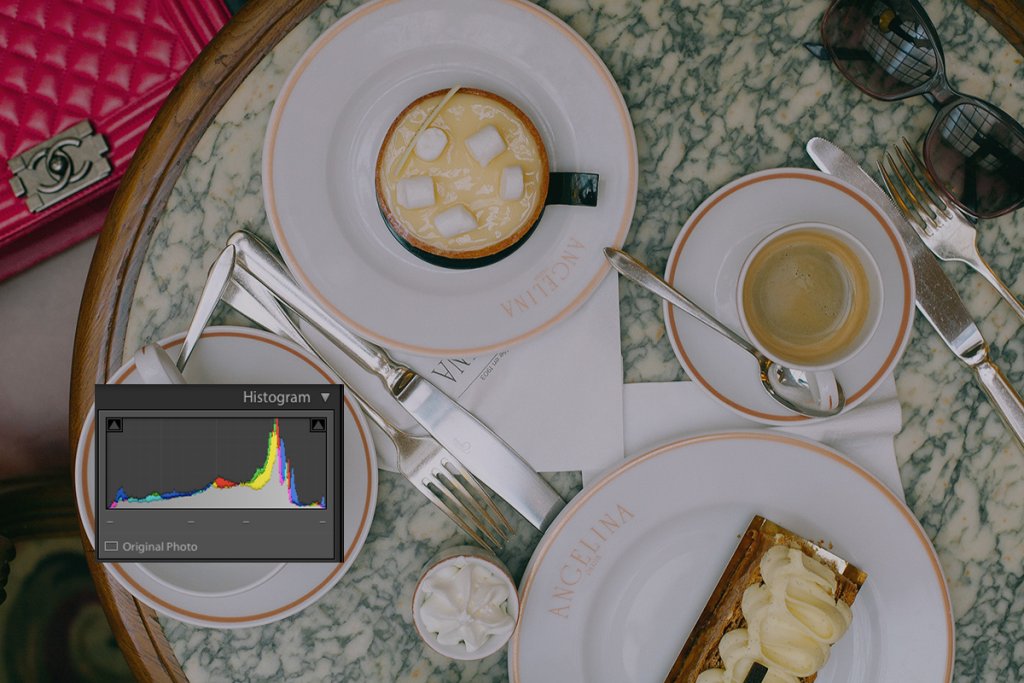
And then a histogram of a bright image will be skewed to the right.
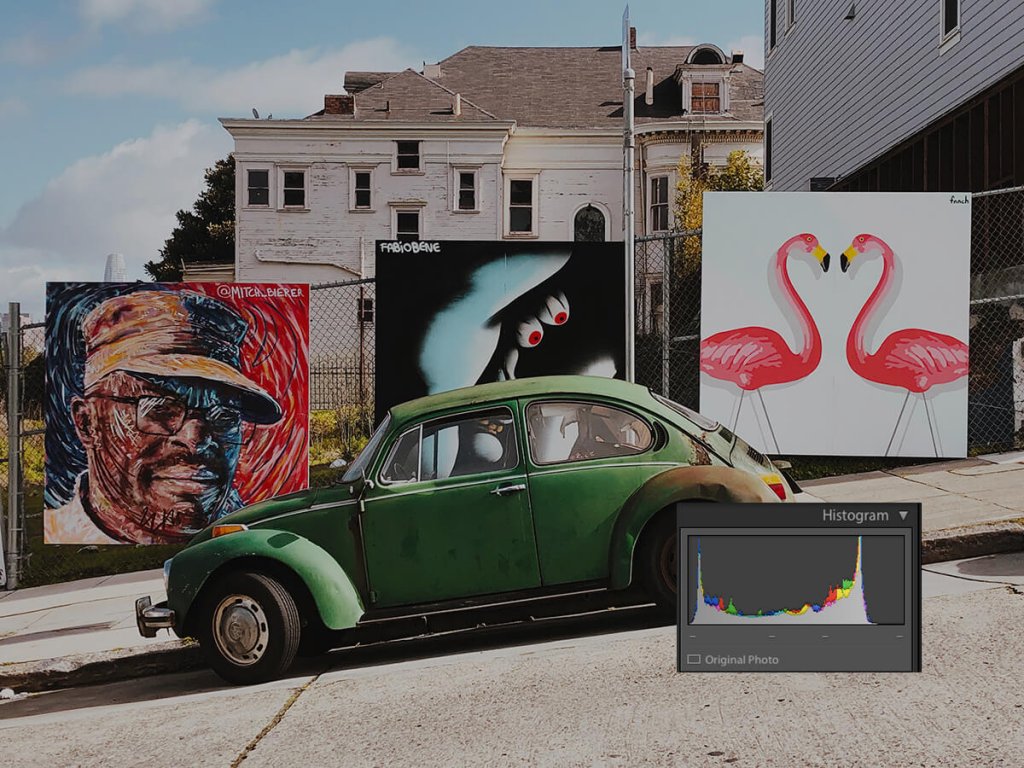
As they say, beauty is in the eye of the beholder, and there is no such thing as the right histogram. But a balanced well-exposed image tends to peak somewhere in the middle of the histogram, just like in this image:
However, don’t trust histograms too much. A picture with snow would have a histogram skewed to the right, but it does not mean the picture is overexposed. Photographers produce different images with many styles, and sometimes you need to rely on your taste and perception.
How to read a histogram
Now you know how the histogram works. You will find yourself using histogram more and more. Take your camera and switch to playback mode to see the histogram every time you take a picture.
Keep an eye on histograms with dramatic peaks. They mean that you have too many black or white pixels. In most cases, this situation may be a sign that you have under- or overexposed an image. However, remember that a histogram is simply a tool that can give you more information about your image.
When you are going to take a photo, think of your exposure. Set your digital camera to manual mode, and set up the proper aperture, shutter speed, and ISO. Take a picture and review it for exposure and composition. Then check your histogram. Users of Canon cameras, click on the Info button to see it.